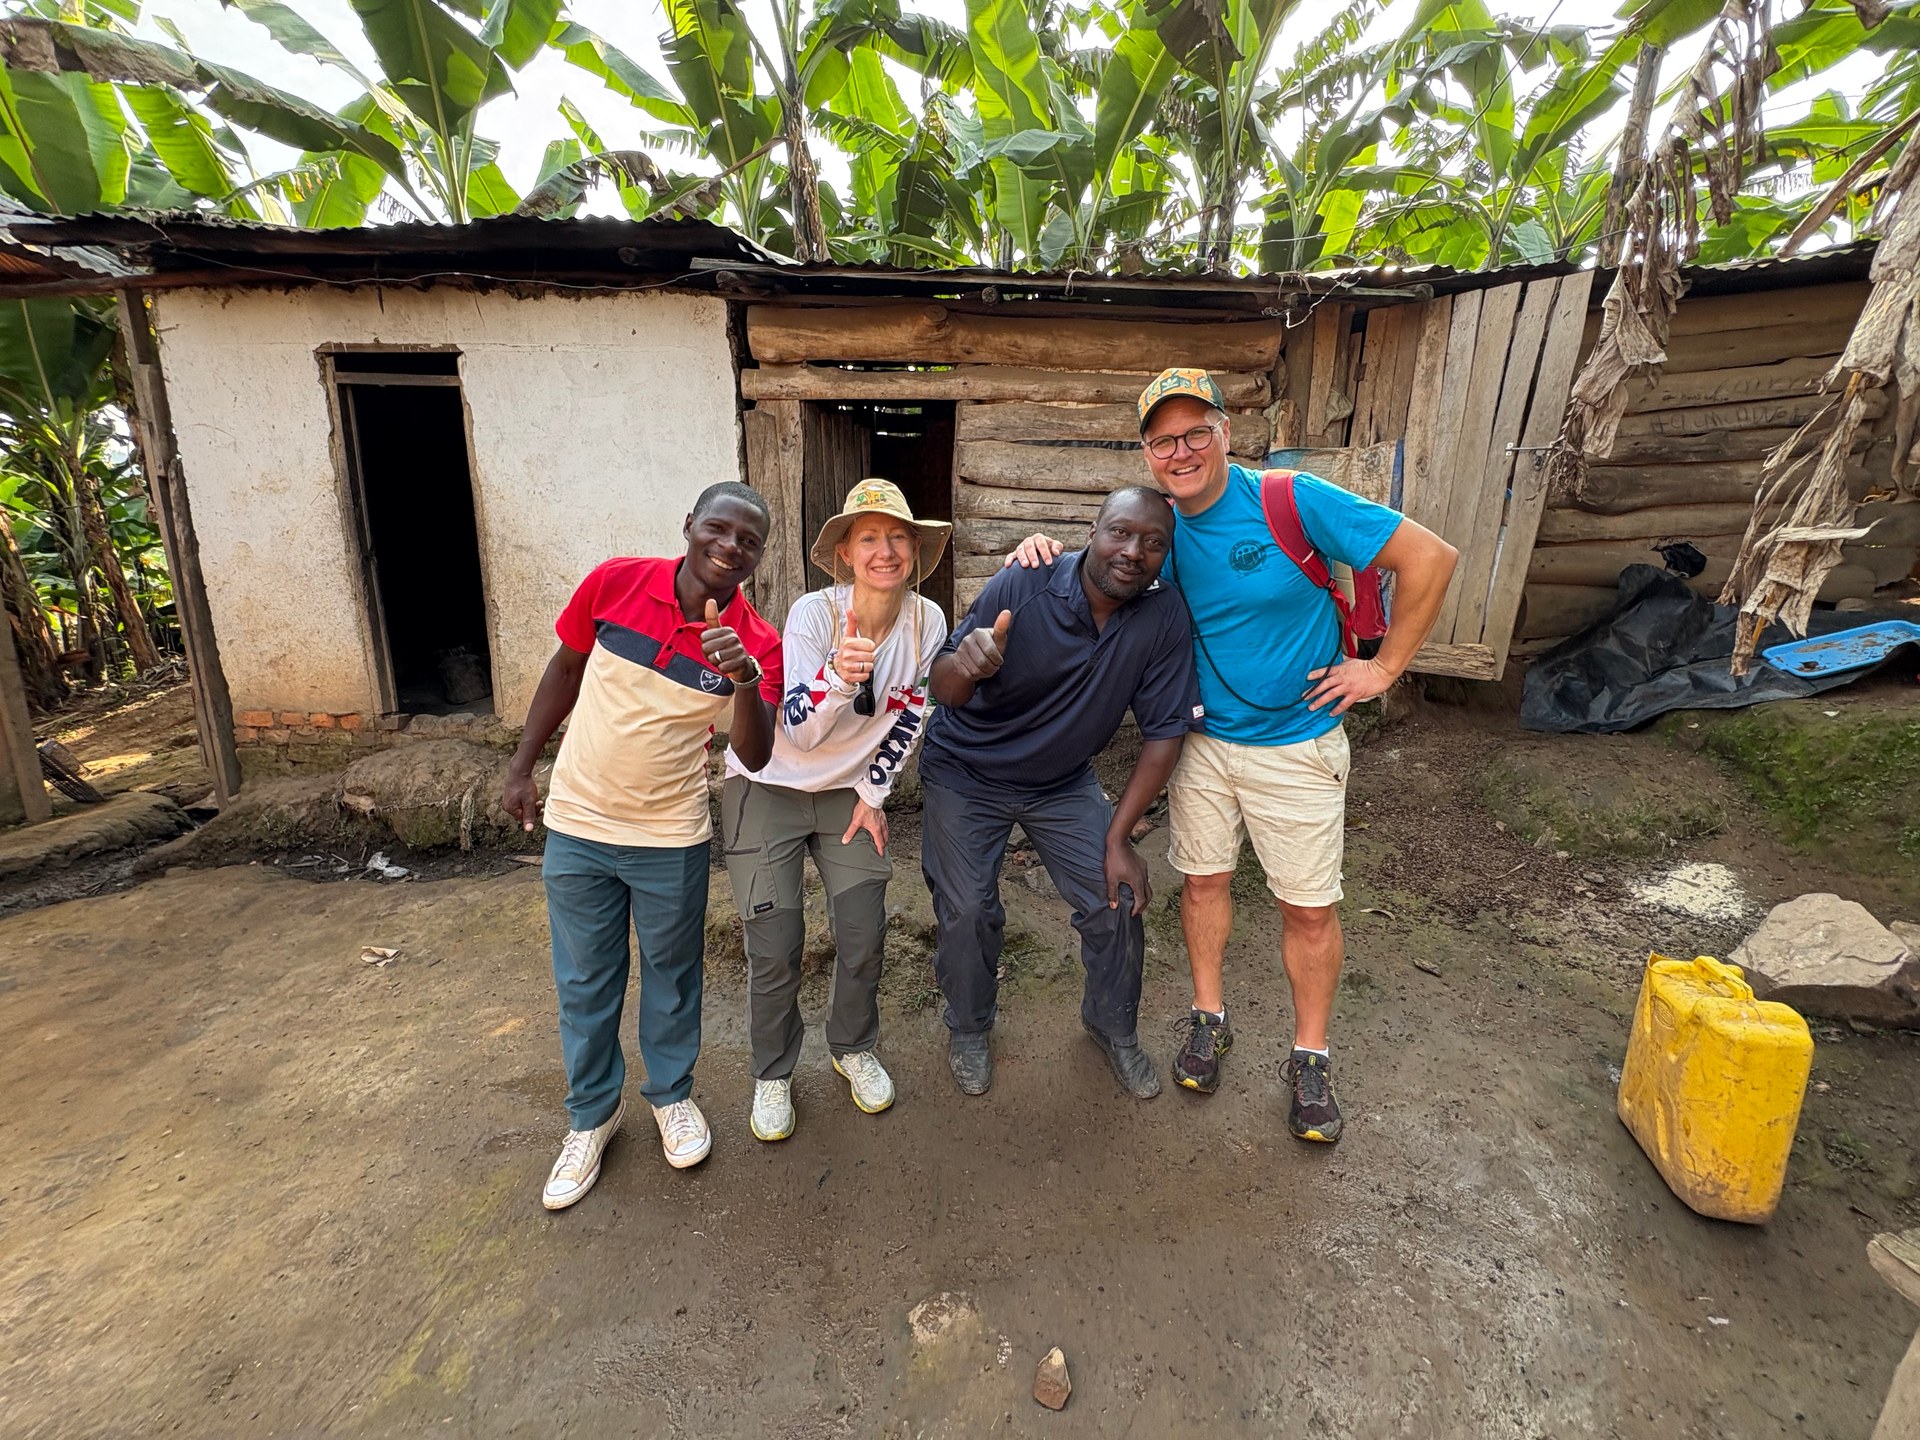
We visited the local chicken farmer to see how the chicks are kept and raised. The farmer lives this very intensely and treats the chicks with genuine care — the enclosures were clean, the birds well-fed, the operation modest but methodical. We have bought chicks there multiple times for the orphanage nearby — they are kept either for eggs or for meat, depending on the breed and the immediate needs of the children. That farmer, photographed at GPS coordinates −0.9676°N, 29.6195°E in June 2026, exists in a local economy that depends, directly and measurably, on whether the lodges surrounding Bwindi Impenetrable National Park fill their rooms.
When a room is occupied, money moves. It pays the lodge staff, purchases food from local farmers, funds the chicken farmer’s operation, and supports the orphanage where those chicks end up. When a room stands empty, that chain goes quiet. The occupancy rate of a lodge is not an abstract statistic — it is the measure of how much economic oxygen reaches communities like the one around Buhoma. Understanding Uganda’s rooms, beds, and occupancy data is therefore not merely an exercise in tourism economics. It is a way of reading the economic health of some of the most remote and vulnerable communities in East Africa.
Across fourteen documented visits to Uganda between October 2024 and June 2026 — totalling fifty-nine days on the ground, with GPS-verified photography throughout — I have observed the accommodation sector from the inside, staying in properties from Kampala to the Bwindi corridor, from Lake Bunyonyi to the Queen Elizabeth National Park buffer zone. What follows draws on the Uganda Bureau of Statistics’ (UBOS) Statistical Abstract series from 2014 through 2016, the Tourism Satellite Account (TSA) 2025, the Ministry of Tourism, Wildlife and Antiquities (MTWA) occupancy surveys, and what I witnessed firsthand in communities where a few percentage points of occupancy rate determine whether children eat chicken or go without.
National Capacity — 350,550 Rooms and 371,221 Beds
The Tourism Satellite Account (TSA) 2025, the most recent comprehensive assessment of Uganda’s tourism infrastructure, establishes the country’s total accommodation capacity at 350,550 rooms and 371,221 beds. These figures encompass the full range of accommodation types — hotels, safari lodges, eco lodges, guesthouses, community rest camps, serviced apartments, campsites, motels, and resorts — across the country’s districts and regions. The ratio of beds to rooms (approximately 1.06:1) indicates that Uganda’s accommodation sector is dominated by single and double occupancy configurations, which is consistent with a market where business travel in Kampala and couple-oriented safari tourism in the national park corridors account for the majority of demand.
Of this total capacity, 117 facilities have been formally graded by the Uganda Tourism Board, comprising 77 town hotels and 23 safari lodges, with the remaining 17 distributed across other accommodation categories. That means the formally assessed sector represents a fraction of the total supply — a reflection of the challenge inherent in grading an industry where new properties open continuously and many smaller establishments operate without formal registration. The UTB’s grading programme targeted 100 properties for assessment in FY2023/24 but completed only 35, because many establishments were found unprepared for inspection.
The last comprehensive national accommodation facilities census was conducted in 2011, with a follow-up linked to the 2014 housing census, according to the Statistical Abstract 2014. Subsequent data in the Statistical Abstract series relies on a sample survey covering 20 districts distributed nationally, including Kampala. This methodological distinction — between a census that attempts to count everything and a survey that samples representative districts — is critical for interpreting any capacity or occupancy figure. The 350,550-room total from the TSA 2025 represents the most authoritative current estimate, but it aggregates formal and informal supply in ways that mask the enormous diversity between a five-star hotel in Kampala and a single-room guesthouse in a rural trading centre.
Room and Bed Occupancy — The FY2014/15 Baseline
The Statistical Abstract 2015 provides the most detailed regional breakdown of occupancy rates in the UBOS series. For the financial year 2014/15, Uganda’s national average room occupancy stood at 48.2 percent, with average bed occupancy at 47.7 percent. These figures mean that, on any given night, roughly half of Uganda’s surveyed accommodation capacity was occupied and half stood empty. The near-parity between room and bed occupancy rates reinforces the single/double occupancy pattern — rooms that are filled tend to have their beds filled as well, with relatively little difference between the two metrics.
The regional variation, however, tells a far more nuanced story. The Northern region recorded the highest occupancy rates in FY2014/15, with 54.5 percent room occupancy and 54.4 percent bed occupancy. This may seem counterintuitive — the north is not Uganda’s primary safari destination and has historically been associated more with post-conflict humanitarian operations than leisure tourism. But the explanation lies in supply constraints: the Northern region has relatively few accommodation facilities, and those that exist serve a steady demand from NGO workers, government officials, and the growing trickle of adventurous tourists heading to Kidepo Valley National Park. When supply is thin and demand is consistent, occupancy rates run high even if absolute visitor numbers are modest.
At the other end of the spectrum, the Eastern region recorded the lowest average occupancy at approximately 42.0 percent. The east of Uganda, anchored by Jinja (the historic “source of the Nile” town) and Mbale, has accommodation supply that outpaces the tourism demand the region currently generates. While Jinja has established itself as an adventure tourism hub — offering white-water rafting, bungee jumping, and the Nile experience — the wider Eastern region, including Mount Elgon and the Sipi Falls area, has not yet developed the concentrated visitor flow needed to fill the rooms that have been built in anticipation of growth.
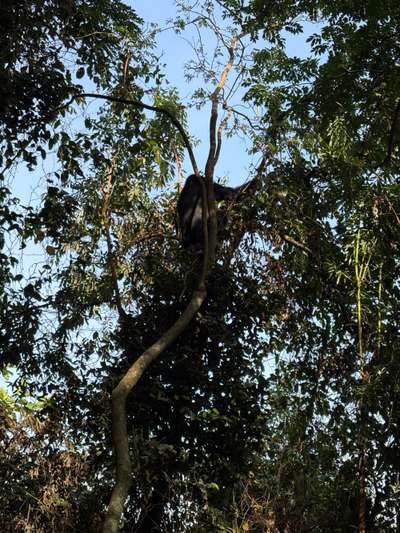
The Western region, which includes the gorilla trekking corridor around Bwindi and the game-drive territory of Queen Elizabeth National Park, recorded occupancy rates in the middle of the national range for FY2014/15. This is because the Western region contains both high-demand safari lodges with near-permanent occupancy during peak season and a growing number of budget guesthouses and community camps where supply has expanded faster than demand. During our gorilla trekking in January 2026, we encountered our first gorilla family after roughly one hour of hiking — a magnificent individual sitting high in a tree, calmly feeding on leaves while our group watched from below. That single encounter, at GPS coordinates −0.9735°N, 29.6281°E, represents the kind of experience that fills the high-end lodges to capacity. But the budget properties along the same road often struggle to achieve even 40 percent occupancy outside the December–February and June–September peak seasons.
Regional Comparison — Occupancy Rates by Area and Year
The following table compiles occupancy data from the Statistical Abstract 2015 (FY2014/15) and the Statistical Abstract 2016 (FY2015/16), allowing a year-on-year comparison across Uganda’s five statistical regions. The data reveals both the structural patterns in regional demand and the year-to-year fluctuations that characterise a tourism sector still in its growth phase.
| Region | Room Occ. FY2014/15 | Bed Occ. FY2014/15 | Room Occ. FY2015/16 |
|---|---|---|---|
| Northern | 54.5% | 54.4% | 52.1% |
| Western | — | — | 53.5% |
| Eastern | ~42.0% | — | 51.5% |
| Kampala | — | — | 45.1% |
| Central (excl. Kampala) | — | — | 31.5% |
| National Average | 48.2% | 47.7% | — |
Sources: Statistical Abstract 2015 (FY2014/15 data), Statistical Abstract 2016 (FY2015/16 data). Dashes indicate data not separately reported for that region and period.
Several patterns emerge from this comparison. First, the Central region excluding Kampala recorded the lowest occupancy of any area in FY2015/16 at just 31.5 percent. This region, which surrounds the capital without benefiting from its business-travel demand or its conference infrastructure, represents the challenge of secondary-market accommodation — properties that are too far from Kampala to attract its overflow and too close to be considered remote or distinctive enough to attract safari tourists.
Second, the Eastern region showed the most dramatic improvement between the two years, rising from approximately 42.0 percent to 51.5 percent. This nearly 10-percentage-point increase may reflect the growing popularity of Jinja as an adventure destination, the expansion of business travel along the Kampala–Jinja–Malaba highway corridor, and improved marketing of Mount Elgon and Sipi Falls as complementary destinations to the western safari circuit.
Third, Kampala’s 45.1 percent occupancy rate in FY2015/16 is lower than one might expect for a capital city, but it reflects the paradox of Kampala’s accommodation market: the city has the highest concentration of rooms in the country, fuelled by continuous hotel construction, but the demand — while substantial in absolute terms — does not grow fast enough to absorb the supply. Business hotels, conference venues, and transit properties compete intensely for a finite pool of travellers, many of whom spend only a single night in Kampala before departing for safari destinations.
Recent Trends — Occupancy Rising to 55.9 Percent
The most recent occupancy data available comes from the Ministry of Tourism, Wildlife and Antiquities (MTWA) accommodation occupancy survey for 2024–2025, which reports that regional occupancy rose from 46.6 percent to 55.9 percent over the survey period. This represents a significant upward movement and suggests that Uganda’s accommodation sector is entering a more mature phase in which demand is catching up with the supply built during the post-COVID recovery period.
The trajectory from 48.2 percent national average in FY2014/15 to 55.9 percent regional average in 2024–2025 represents nearly a decade of gradual improvement, punctuated by the severe disruption of the COVID-19 pandemic, which effectively shut down Uganda’s international tourism sector from March 2020 through much of 2021. That the sector has not only recovered but surpassed its pre-pandemic occupancy levels speaks to the underlying strength of Uganda’s tourism proposition — gorilla trekking, safari game drives, the Nile experience, and a growing portfolio of cultural and community tourism products.
The GDP contribution data from the Statistical Abstract 2014 provides useful historical context: hotels and restaurants contributed 3,110 billion Ugandan shillings to GDP in 2013, up from 2,768 billion shillings in 2012 — an increase of 12.4 percent in a single year. The sector has been a consistent contributor to GDP since at least 2008. While more recent GDP breakdowns are not directly comparable due to methodological changes, the combination of rising occupancy rates and increasing international arrivals strongly suggests continued growth in the sector’s economic contribution.
The Human Infrastructure — 10,679 Tourism Graduates and the Workforce Behind the Numbers
Behind every occupancy statistic is a workforce. The Statistical Abstract 2015 records 10,679 tourism graduates in Uganda — individuals who have completed formal training programmes in hospitality, tourism management, and related disciplines. This figure represents the formally trained segment of a much larger workforce that includes on-the-job trained staff, community guides, porters, cooks, drivers, and the informal service providers who make up the extended ecosystem around every lodge and hotel.
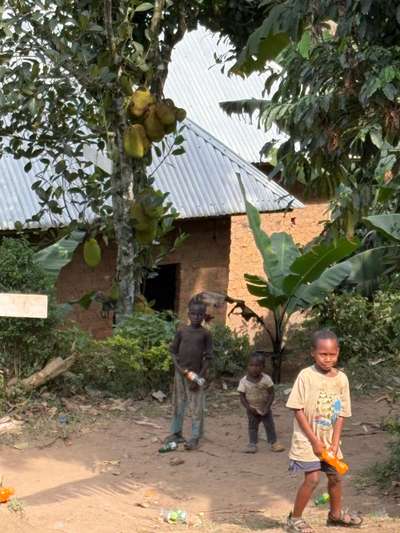
During my visit to Buhoma in June 2026, the relationship between lodge employment and community welfare was visible at every turn. Children from the neighbourhood near the orphanage appeared at the compound — visibly shy, their clothing worn thin. We invited them to eat with us immediately. The meal was not elaborate, but it was there because the local economy, sustained by lodges that fill their rooms, generates enough activity to support food vendors, small farmers, and the community structures that keep children fed. When those rooms stand empty — as they did during the pandemic shutdowns — the consequences cascade through these communities with devastating speed.
The 10,679 tourism graduates represent a formal investment in human capital for the sector, but the gap between formal training and the actual staffing needs of Uganda’s accommodation properties remains significant. Many lodges in remote tourism corridors — particularly around Bwindi, Mgahinga, and Kidepo — rely on locally recruited staff who learn on the job, supervised by a small number of formally trained managers. The quality of service in these properties often depends less on formal qualifications and more on the commitment and natural hospitality of the local workforce — a quality I have observed consistently across my fourteen visits.
What Occupancy Means on the Ground — Field Observations from 59 Days
Statistics describe a sector in the aggregate. They do not describe the specific reality of a lodge where a five-percentage-point increase in annual occupancy means the difference between retaining a cook and letting one go. Across my fourteen visits to Uganda, I have observed the accommodation sector at a level of detail that national surveys cannot capture, and three patterns stand out consistently.
First, the occupancy data underestimates the seasonal extremes. A lodge near Bwindi that reports 50 percent annual occupancy may be running at 90 percent from December through February and again from June through September, while dropping to 15 or 20 percent during the long rains in March–May. The annual average masks a business reality that is far more volatile than the number suggests. Lodge operators in the Bwindi corridor manage this volatility by reducing staff hours during low season, deferring maintenance, and in some cases closing entirely for weeks at a time — none of which appears in the occupancy statistics.
Second, the distinction between room occupancy and revenue occupancy matters enormously. A room may be occupied at a steep discount during low season or filled by a local guest paying a fraction of the international rate. The 48.2 percent national room occupancy figure from FY2014/15 says nothing about the revenue those occupied rooms generated. Two lodges with identical occupancy rates can have radically different financial health depending on their pricing structure, their guest mix (international versus domestic), and their cost base.
Third, the growth from 46.6 percent to 55.9 percent in the MTWA 2024–2025 survey aligns with what I observed on the ground during my visits in that period. Properties that were visibly struggling in late 2024 — empty rooms, skeleton staff, deferred maintenance — were noticeably busier by mid-2026. The recovery was uneven — high-end lodges with strong international booking relationships recovered fastest, while budget properties dependent on walk-in domestic travellers lagged behind — but the direction was unmistakably positive.
The 20-district survey methodology that underpins the official occupancy statistics captures this broad trend accurately, even if it misses the micro-level volatility. What it cannot capture — and what only a visit can reveal — is the texture of what occupancy means in communities like Buhoma: the chicken farmer who has buyers when the lodges are full and none when they are empty, the children who eat when the tourism economy is functioning and go without when it stalls. The numbers are the skeleton. The visits provide the living tissue around the bones.
What This Means for Travellers Planning a Uganda Trip
For travellers considering a visit to Uganda, the occupancy data carries practical implications. The Western region’s 53.5 percent occupancy in FY2015/16 and the Northern region’s consistently high rates mean that lodges in these areas — particularly those near Bwindi, Queen Elizabeth, Murchison Falls, and Kidepo — can fill up during peak season. Advance booking is not optional for high-demand properties in the gorilla trekking corridor between December and February or June and September. A 53.5 percent annual average translates to near-full occupancy during peak months, and the best properties will be booked months in advance.
Conversely, the Central region’s 31.5 percent occupancy and Kampala’s 45.1 percent represent buyer’s markets where travellers can expect competitive pricing, room availability, and the leverage to negotiate. For travellers spending a night or two in Kampala before or after a safari, the oversupply of rooms works in their favour. The challenge is sorting through the options — which is precisely what this website exists to help with.
The upward trend to 55.9 percent regional occupancy in 2024–2025 suggests that the window of easy availability at popular safari lodges is narrowing. Uganda’s tourism sector is growing, international arrivals are increasing, and the supply of high-quality accommodation in the prime safari corridors has not kept pace. Travellers who wait until the last moment to book gorilla trekking accommodation will increasingly find themselves pushed to second-choice properties or paying premium rates for last-minute availability. The data supports a clear recommendation: book early, particularly for the Western and Northern regions during peak season.