Uganda Hotel Occupancy by Quarter — Seasonal Patterns, Room Availability and What the Data Means for Travellers
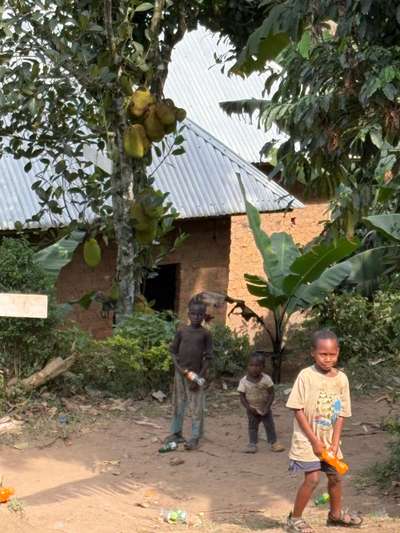
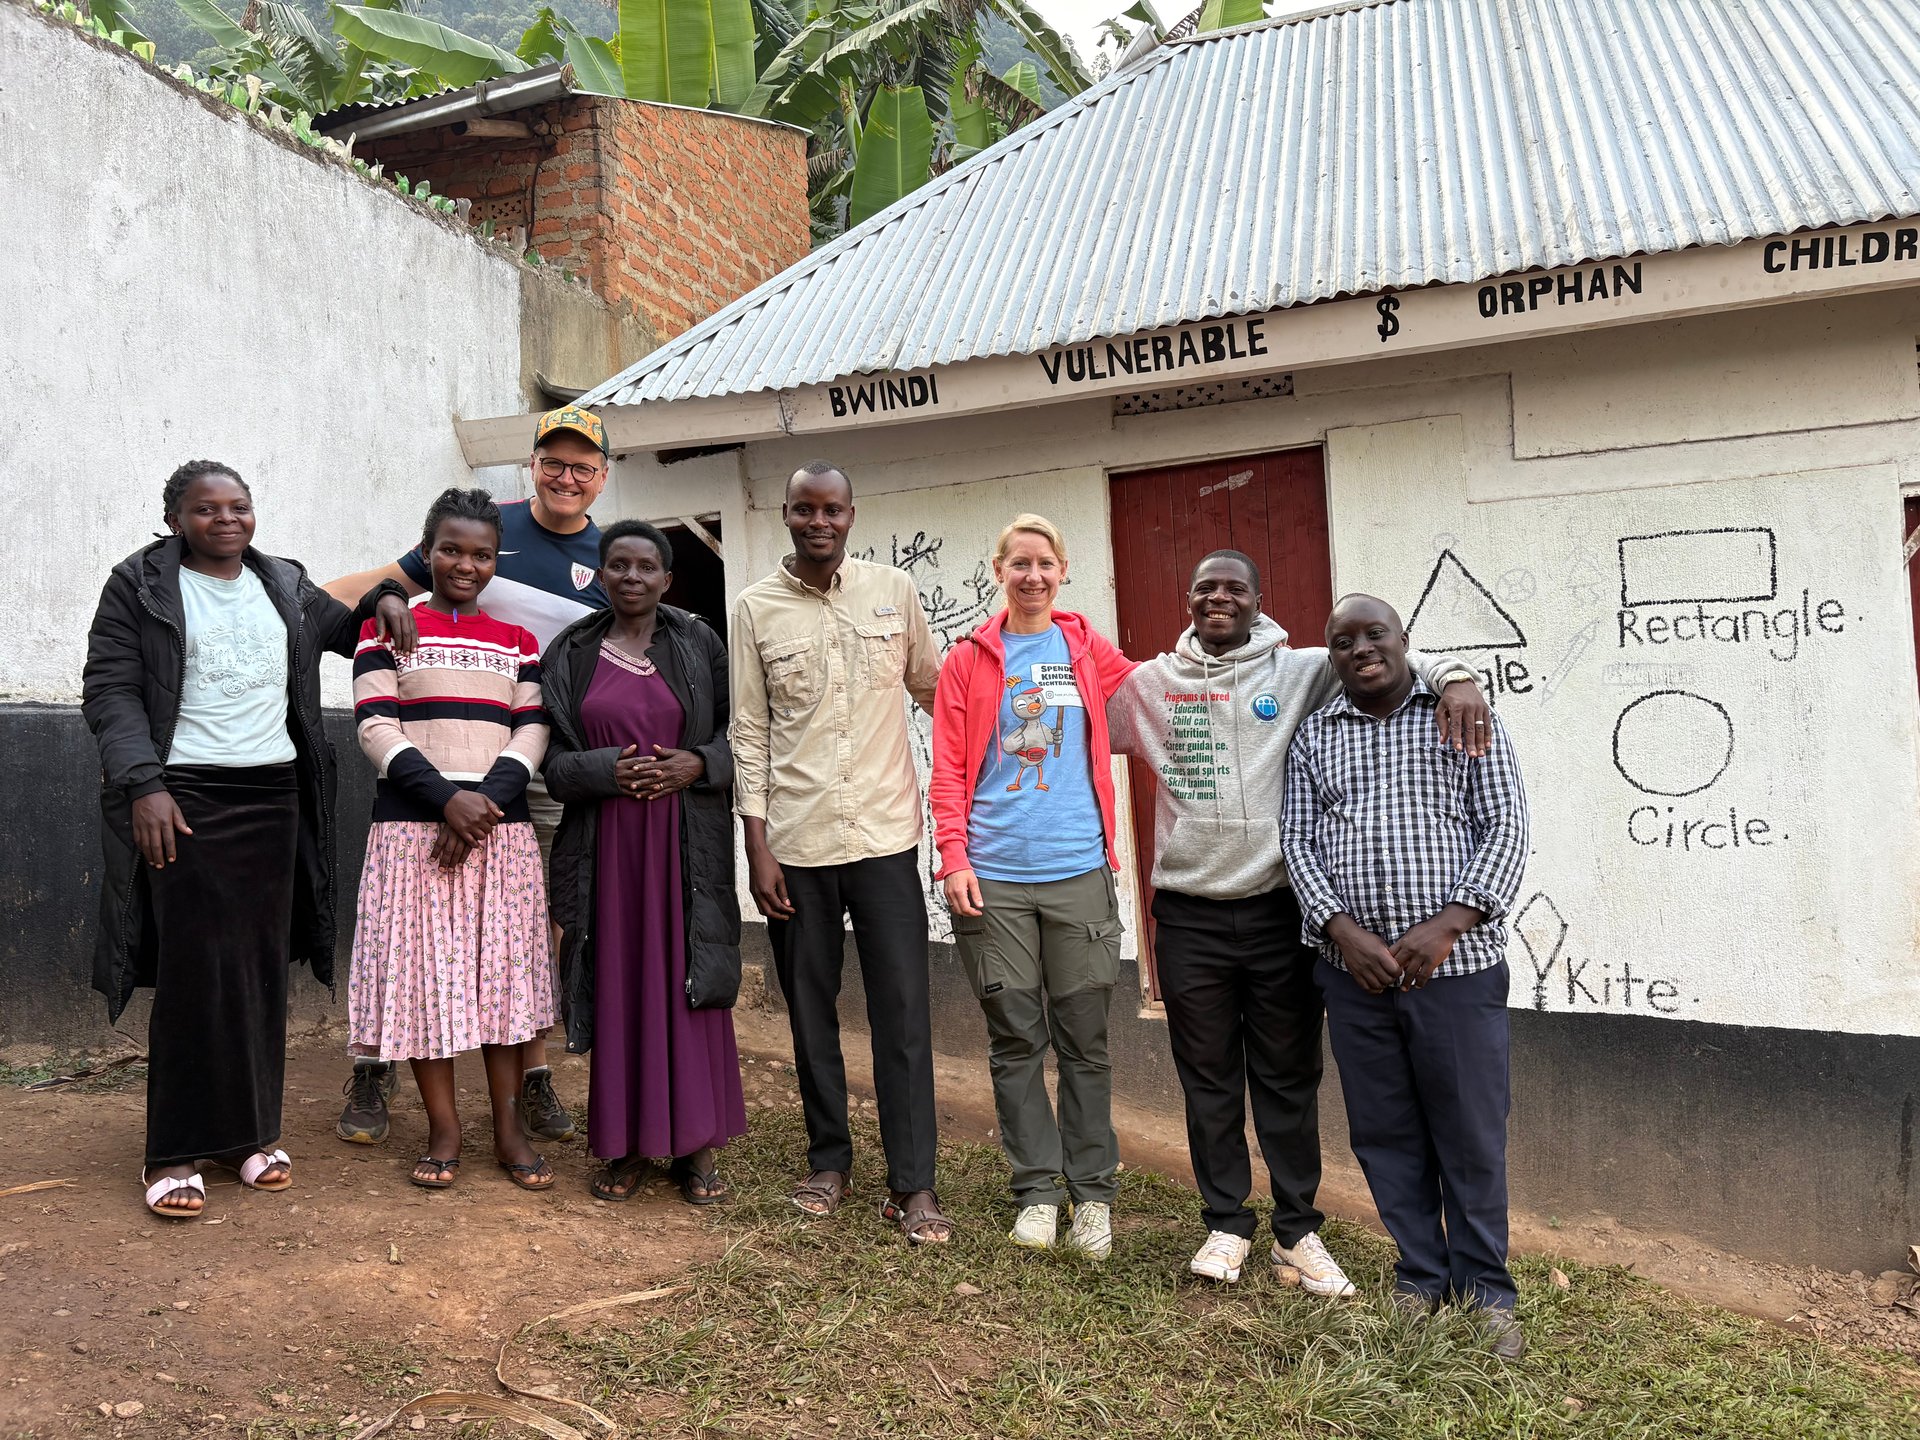
Three children stood near the orphanage wall in Buhoma during my June 2026 visit, their clothes worn thin and their body language cautious. We noticed them watching from a distance and invited them to eat with us immediately. It was early morning — just after 6:30, the GPS on my camera reading -0.9617, 29.6109 — and the lodges up the hill were already preparing breakfast for guests who had paid anywhere from $80 to $600 for their rooms. The gap between occupancy statistics and lived reality is wide, but the numbers still tell a useful story for anyone planning a trip to Uganda.
Having visited Uganda 14 times over 59 days between October 2024 and June 2026, I have experienced the country's accommodation patterns across every season — the January dry period when lodges near Bwindi are full, the April-May rains when availability opens up, and the June-July transition when prices begin to climb again. This article breaks down the quarterly occupancy data from official government sources and translates it into practical booking guidance.
Uganda's Ministry of Tourism, Wildlife and Antiquities (MTWA) conducts accommodation surveys that track room and bed occupancy by quarter and by region. The data reveals distinct seasonal patterns that differ significantly between urban centres like Kampala and safari regions in the West and North.
National Quarterly Occupancy — The Baseline Numbers
The most detailed publicly available quarterly data comes from the Statistical Abstract 2015, covering fiscal year 2014/15. Room occupancy refers to the number of rooms occupied relative to available rooms; bed occupancy tracks beds occupied relative to available beds. For FY2014/15, the national average room occupancy rate was 48.2 percent, while bed occupancy averaged 47.7 percent.
Quarter two (October-December) recorded the highest national room occupancy at 51.5 percent, according to the Ministry of Tourism, Wildlife and Antiquities. Quarter one (July-September) showed the lowest rates at 46.1 percent. The difference is modest at the national level, but when broken down by region, seasonal swings become much more pronounced.
| Metric | Q1 | Q2 | Q3 | Q4 | Average |
|---|---|---|---|---|---|
| Room Occupancy | 46.1% | 51.5% | 48.3% | 47.1% | 48.2% |
| Bed Occupancy | 46.7% | 48.4% | 47.5% | 48.3% | 47.7% |
By 2024-2025, the picture has improved considerably. The MTWA Accommodation Survey 2025 documented regional occupancy climbing from 46.6 percent to 55.9 percent, reflecting growing tourism demand and improved accommodation infrastructure outside the capital. This near-10-percentage-point increase over a decade represents real growth in Uganda's tourism economy.
Regional Quarterly Data — Where the Patterns Diverge
The national averages mask dramatic regional differences. The quarterly breakdown by region reveals which areas are constrained by supply, which suffer from oversupply, and when each region experiences peak demand.
| Region | Q1 | Q2 | Q3 | Q4 | Avg |
|---|---|---|---|---|---|
| Central | 46.5% | 56.4% | 51.6% | 47.2% | 50.4% |
| Eastern | 45.2% | 48.1% | 38.3% | 36.5% | 42.0% |
| Kampala | 41.0% | 51.1% | 49.2% | 48.5% | 47.5% |
| Northern | 54.7% | 53.8% | 53.8% | 55.9% | 54.5% |
| Western | 44.5% | 47.7% | 47.6% | 46.7% | 46.6% |
| National | 46.1% | 51.5% | 48.3% | 47.1% | 48.2% |
Northern Uganda stands out with the highest and most stable occupancy rates — never dropping below 53.8 percent in any quarter. This reflects limited supply around Murchison Falls and Kidepo Valley national parks rather than unusually high demand. With few lodges serving two of Uganda's most spectacular parks, the existing properties stay consistently full.
The Central region (excluding Kampala) shows the widest quarterly swings, peaking at 56.4 percent in Q2 and dropping to 46.5 percent in Q1. This pattern tracks the conference and business calendar in towns like Jinja and Mukono.
The Eastern region recorded the lowest occupancy across all quarters, with a particularly sharp decline in Q3 (38.3%) and Q4 (36.5%). This reflects both low tourist demand for destinations like Mount Elgon and Sipi Falls relative to Western Uganda's parks, and a surplus of basic accommodation in transit towns along the Kenyan border.
Western Uganda, despite hosting the country's most popular safari destinations, shows moderate occupancy in the FY2014/15 data (46.6% average). This is partly because the region has built substantially more lodge capacity than other areas, and partly because the survey includes lower-tier accommodation that the international tourism market does not fully utilise.
The FY2015/16 Shift — How Patterns Changed
By FY2015/16, the quarterly patterns had shifted in notable ways, according to the Statistical Abstract 2016. The Western region's average room occupancy jumped to 53.5 percent, driven by strong Q3 and Q4 performance (58.3% and 58.2% respectively). This aligns with the global gorilla trekking boom that accelerated from 2015 onward.
| Region | Q1 | Q2 | Q3 | Q4 | Avg |
|---|---|---|---|---|---|
| Central | 48.1% | 32.9% | 21.8% | 23.0% | 31.5% |
| Eastern | 49.1% | 49.9% | 51.3% | 55.5% | 51.5% |
| Kampala | 47.0% | 44.1% | 41.9% | 47.2% | 45.1% |
| Northern | 54.3% | 52.3% | 50.7% | 50.9% | 52.1% |
| Western | 44.7% | 52.9% | 58.3% | 58.2% | 53.5% |
| National | 49.6% | 47.4% | 45.8% | 47.7% | 47.6% |
The Central region's dramatic drop to 31.5 percent average is striking — down from 50.4 percent the previous year. Meanwhile, the Eastern region reversed its underperformance, climbing to 51.5 percent with a strong Q4 at 55.5 percent. These year-over-year shifts demonstrate how volatile Uganda's accommodation market can be, influenced by infrastructure projects, political events, and shifts in regional tourism promotion.
The Northern region maintained its position as the most consistently occupied, though its average declined slightly from 54.5 percent to 52.1 percent. Kampala held steady in the mid-40s, confirming its dependence on business rather than leisure demand.
What This Means for Booking — Practical Advice
For travellers, quarterly occupancy data translates directly into availability and pricing leverage. Here is how to use it:
Bwindi and Western Uganda: Peak occupancy in Q3-Q4 (roughly January-June in calendar terms) means gorilla trekking lodges are most competitive in Q1 (July-September). During my May 2026 visit — 13 days on the ground — I found lodges in Buhoma and Rushaga offering rates 15-25 percent below their published high-season prices. However, gorilla permits ($800 per person) sell out regardless of season, so book those as far ahead as possible even if lodge rates are negotiable.
Murchison Falls and Northern Uganda: With occupancy above 50 percent year-round, this region offers less seasonal pricing flexibility. Book 3-6 months ahead for any time of year. The limited lodge supply near Kidepo Valley means last-minute availability is rare.
Kampala and Entebbe: The lowest occupancy quarter (Q1, around 41-47%) corresponds roughly to July-September. Business hotels drop rates during this period, making Kampala an affordable pre-safari or post-safari stop. Conference season (typically October-March) pushes rates up by 20-30 percent at mid-range and upscale properties.
Eastern Uganda: With the lowest occupancy rates nationally, this region offers the best value year-round. Lodges near Sipi Falls and Mount Elgon are rarely fully booked, and walk-in rates are common. If your itinerary includes Jinja for adventure activities, accommodation is abundant and competitive.
The Bigger Picture — Sector Growth and GDP Impact
Uganda's hotel sector is not just a service industry — it is a significant contributor to the national economy. The contribution of hotels and restaurants to GDP rose from 2,768 billion Ugandan Shillings in 2012 to 3,110 billion Shillings in 2013, representing a 12.4 percent year-on-year increase, according to the Statistical Abstract 2014. Between 2008 and 2013, the sector maintained consistent contributions to the national accounts, though growth varied with external factors including regional security situations and global travel patterns.
By 2025, the tourism accommodation sector had grown substantially. Uganda's total capacity reached 350,550 rooms and 371,221 beds according to the Tourism Satellite Account Report 2025. However, only 117 of these facilities had been formally graded and classified — 77 town hotels, 23 safari lodges, and a handful of tented camps and motels. This grading gap means occupancy data captures only a fraction of the market's full dynamics.
The accommodation survey itself covers 20 districts nationwide, including Kampala. The last full census was conducted in 2011, with subsequent updates relying on sampling rather than comprehensive enumeration. For travellers interpreting these numbers, the key takeaway is that official occupancy figures likely overstate availability at popular destinations (where unregistered small lodges absorb overflow demand) and understate it at less-visited locations.
Frequently Asked Questions
What is the average hotel occupancy rate in Uganda?
The national average room occupancy rate was 48.2% in FY2014/15 (Statistical Abstract 2015). By 2024-2025, regional occupancy had improved to 55.9%, reflecting growing tourism demand (MTWA Accommodation Survey 2025).
Which quarter has the highest hotel occupancy?
Patterns vary by region. Nationally, Q2 (October-December) showed the highest occupancy at 51.5% in FY2014/15. Western Uganda peaks in Q3-Q4 with rates above 58%, while Northern Uganda stays above 50% year-round.
When is the cheapest time to book a lodge in Uganda?
Q1 (July-September) typically has the lowest national occupancy. The March-May rainy season also softens demand. During these periods, lodges may offer rates 15-25% below peak season. However, gorilla permits sell out regardless of season.
How does Kampala compare to safari regions?
Kampala averaged 45.1% room occupancy in FY2015/16 — lower than the Northern (52.1%) and Western (53.5%) regions. Kampala tracks business cycles, not tourist seasons.
Is Uganda's hotel sector growing?
Yes. Total capacity reached 350,550 rooms by 2025. Hotels and restaurants contributed 3,110 billion UGX to GDP in 2013, up 12.4% year-on-year. Regional occupancy climbed nearly 10 percentage points between 2024-2025.